

Using libraries like NumPy, Pandas, and Matplotlib
When we use other supported program library frameworks in the Python programming language, the Python language becomes even more functionally feature-supported or powerful. In the Python software development environment, these libraries define a collection of pre-written program source code that provides essential functions and tools to Python software or database users. This allows Python developers and programmers to easily perform complex program tasks without having to write anything from scratch.

Three essential libraries or supported frameworks in Python.
- NumPy – The Numpy Python programming library provides support for numerical and mathematical database operations.
- Pandas – The Pandas data analysis and data manipulation library provides support for Python programming.
- Matplotlib – The Matplotlib Python programming library provides support for graph charts and data visualization and plotting.
These supported library frameworks in Python programming are used extensively in data science, machine learning, scientific computing, and deep data analysis.
Installing the numpy, pandas, and matplotlib libraries in Python.
These supported library frameworks in Python programming can be manually installed using the pip command statement.
pip install numpy pandas matplotlib
Python users can also install them individually.
pip install numpy
pip install pandas
pip install matplotlib
NumPy is a Python-supported library.
NumPy is a Python-supported library framework used in Python programming. Python programs can be used for numerical data analysis, data binding, data table format storage, etc. in software.
The NumPy library framework is primarily used in Python programming.
- In numerical data statement calculation operations
- In data and information access and retrieval in array and matrices tabular format
- In mathematical numerical calculation operations
- In computer science or statistics data analysis
- In linear algebra problem solving
- In scientific data information computing operations
For numerical data calculations in Python, NumPy provides ndarray, a powerful multidimensional array data structure storage format layout.
Importing NumPy.
import numpy as np
Here np is NumPy’s commonly used short name for arrays.
Creating a NumPy array in a Python program.
A NumPy array can be created in a normal Python program using these object elements.
import numpy as np
numeric = np.array([9, 4, 3, 7, 8, 2, 1])
print(numeric)
The output is.
[9, 4, 3, 7, 8, 2, 1]
Unlike the normal Python list data type, the NumPy array data type is designed or defined for better numerical data calculations.
Python NumPy supports mathematical operations.
Here, we can apply various operations to a complete user-defined custom array data type element value in a Python program.
import numpy as np
numeric = np.array([9, 4, 3, 7, 8, 2, 1])
print(numbers * 3)
print(numbers + 3)
The output is.
[ 27 12 9 21 24 6 3 ]
[ 30 15 12 24 27 9 6 ]
In Numpy data calculation processing, this is called vectorized computation.
NumPy Statistics in Python.
Python provides software developers with several functions for common statistical calculations in NumPy data types.
import numpy as np
salary = np.array([99000, 12000, 87000, 49000, 85000])
print(“Mean is – “, np.mean(salary))
print(“Maximum is – “, np.max(salary))
print(“Minimum is -“, np.min(salary))
print(“Standard deviation is -“, np.std(salary))
The output is.
Mean is – 66,400
Maximum is – 99,000
Minimum is – 12,000
Standard deviation is – 31,922.42
Pandas Python-supported library.
Pandas is a popular database-supported library or framework for the Python programming language, designed and developed specifically for data manipulation and analysis in Python.
The Pandas library framework is primarily used in Python programming for.
- Creating tables
- Creating CSV extension files
- Excel data extension support
- Database file data access features
- Time-series data manipulation tasks
- Missing data management
- Data cleaning tasks
The two most important Pandas data structure formats supported in Python are.
- Series data
- Dataframe data
Pandas Series with Python.
Series is a one-dimensional labeled table data structure format layout table data element storage method in the Python-supported Pandas database library.
import pandas as pd
salary = pd.Series([10000, 12000, 9000, 12400, 13700, 14900])
print(salary)
The Pandas data type used in Python is a series containing numeric values and their corresponding index locations.
The output is.
0 10000
1 12000
2 9000
3 12400
4 13700
5 14900
dtype: int64
Pandas DataFrame in Python.
A DataFrame in Python is a two-dimensional database table structure with a row/column format, storing user-defined row and column numeric values.
import pandas as pd
company_data = {
“Emp_Name”: [“Bhavishi”, “Siddhi”, “Shiva”, “Harry”],
“Salary”: [10000, 8900, 4900, 8900]
}
df = pd.DataFrame(company_data)
print(df)
The output is.
Emp_Name Salary
0 Bhavishi 10000
1 Siddhi 8900
2 Shiva 4900
3 Harry 8900
Here, a DataFrame in Python is represented like a spreadsheet or database table.
Selecting data from a Pandas DataFrame.
Here we can select multiple table columns at once.
print(df[“Emp_Name”])
We can also select multiple column table values at once.
print(df[[“Emp_Name”, “Salary”]])
With this, we can also filter existing table row data elements.
For example, here we only want a list of employees with a salary greater than 7000.
print(df[df[“Salary”] > 7000])
Reading a CSV extension file with the Python Pandas library.
With the Python Pandas database library framework, reading data from a CSV file is easy.
Let’s assume we have a file named employee.csv.
Emp Name, Language, Fee
Bhavishi, Matlab, 3400
Siddhi, Ruby, 1989
Harry, Php, 789
Harry, C#, 1299
Here, we can read this file named employee.csv like this.
import pandas as pd
df = pd.read_csv(“employee.csv”)
print(df)
This automatically converts the data from the CSV file to a DataFrame according to the table used in Pandas.
Basic data analysis methods with the Pandas library framework.
We can use this in the Python Pandas data type.
print(df.head())
Use this to display the first few lines of the data in the Pandas data type.
Use this to display detailed information about the data in the Pandas data frame.
print(df.info())
Use this to display detailed statistical information about a dataframe used in Pandas.
print(df.describe())
Cleaning data from a Pandas database.
Use database data in Python. Real-world data often contains missing values.
For example.
Emp_Name Salary
Bhavishi 10000
Siddhi 8900
Shiva 4900
Harry 8900
With this statement, we can check for missing values in the database.
print(df.isnull())
With this statement, we can remove rows with missing database values.
df = df.dropnull()
With this statement, we can fill in missing database values.
df[“Salary”] = df[“Salary”].fillna(0)
Matplotlib is a Python-supported library.
Like Numpy and Pandas discussed above, Matplotlib is also a popular Python-supported library or framework. The Matplotlib Python library is most commonly used for developing graphical image graphs and data visualization format layout designs.
The Python Matplotlib library helps Python users with these tasks.
- Line chart design development
- Bar chart design development
- Pie chart design development
- Histogram design development
- Scatter plot generation
- Custom scientific plot design
In Python, you can import it like this.
import matplotlib.pyplot as plt
Python Matplotlib library line plot.
A simple line graph can be created in Python’s Matplotlib using these x and y coordinates.
import matplotlib.pyplot as plt
x = [10, 20, 30, 40, 50, 60, 70]
y = [13, 23, 39, 47, 55, 66, 89]
plt.plot(x, y)
plt.xlabel(“Day by day”)
plt.ylabel(“Website”)
plt.title(“Organic Traffic Report”)
plt.show()
The output is.
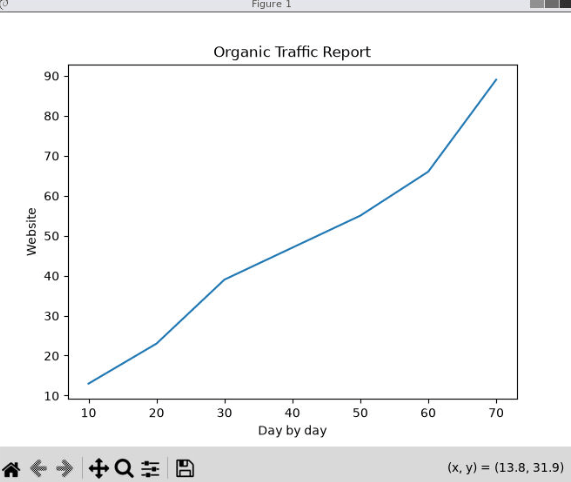
This Matplotlib program displays a line graph showing the organic traffic values of a website based on the x and y coordinates of the chart above.
Bar Chart Matplotlib with Python.
A simple bar chart can be designed and developed in Python’s Matplotlib with the following data and information:
import matplotlib.pyplot as plt
language = [“Matlab”, “Ruby”, “C#”, “Ai”, “Swift C”, “Php”]
fee = [999, 1000, 1200, 1700, 900, 800]
plt.bar(language, fee)
plt.xlabel(“language”)
plt.ylabel(“fee”)
plt.title(“language fee”)
plt.show()
The output is.
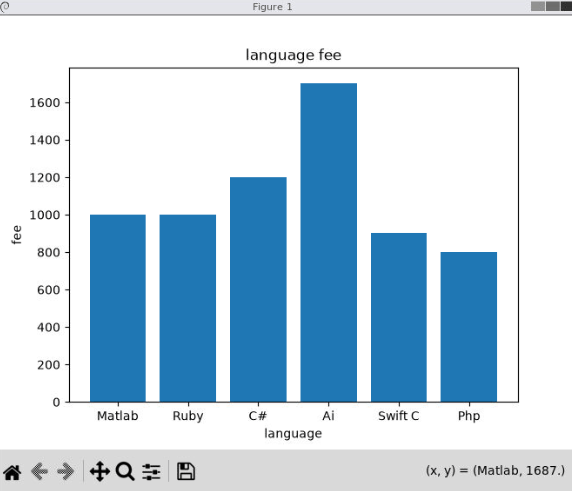
These Matplotlib programs can be useful for comparing data and information in a bar chart category.
Scatter Plot Matplotlib with Python.
A simple scatter plot in Python’s Matplotlib represents the relationship between two numerical variables.
import matplotlib.pyplot as plt
emp_work_hours = [1, 2, 3, 4, 5, 6, 7, 8]
salary = [10,000, 12,000, 20,000, 30,000, 40,000, 50,000, 70,000, 90,000]
plt.scatter(emp_work_hours, salary)
plt.xlabel(“emp_work_hours”)
plt.ylabel(“salary”)
plt.title(“emp_work_hours vs. salary”)
plt.show()
The output is.
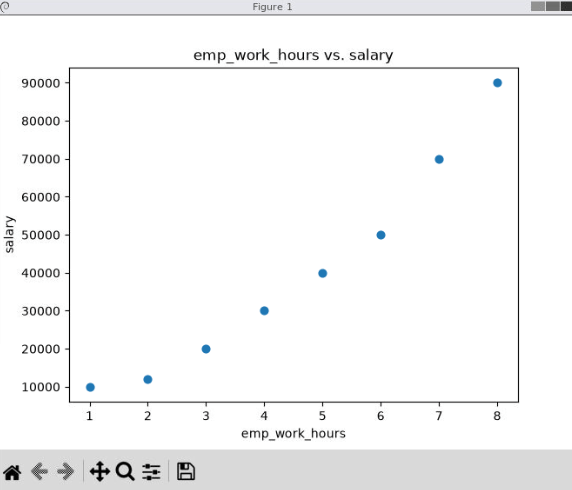
This Matplotlib program helps us to find out the salary of each employee according to his working hours.
Using the NumPy, Pandas, and Matplotlib libraries together in Python.
Python developers can make their programs more powerful by using these three library frameworks together to suit their software development needs.
For example.
Python Program Data
↓
Pandas Library Framework
↓
Clean and Analyze Task
↓
NumPy Library Framework
↓
Mathematical Analysis Task
↓
Matplotlib Library Framework
↓
Data Information Visualization Representation
Example of the Python NumPy, Pandas, and Matplotlib libraries.
import pandas as pd
import matplotlib.pyplot as plt
data = {
“Year”: [“2021″,”2022″,”2023″,”2024″,”2025″,”2026”],
“Sales_unit”: [1000, 2000, 4000, 10000, 20000, 40000]
}
df = pd.DataFrame(data)
plt.plot(df[“Year”], df[“Sales_unit”], marker=”o”)
plt.xlabel(“Year”)
plt.ylabel(“Sales_unit”)
plt.title(“Yearly Sales_unit”)
plt.show()
The output is.
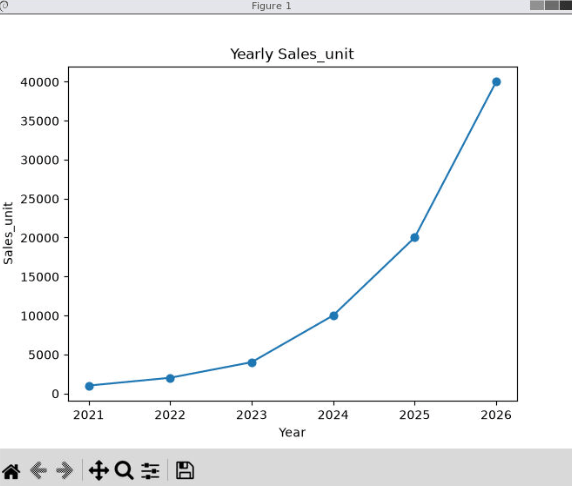
Here in this program explanation.
- The Pandas library stores and represents data in a DataFrame.
- Matplotlib creates a graph based on the available data information.
- If this program requires numerical data information calculations, the data can also be processed and managed using NumPy.
Main Difference Between NumPy, Pandas, and Matplotlib Libraries
| Each library | What is purpose | Important feature of each |
| Numpy libraries | It helps you to manage all kind of numerical data computing task | It helps to manage arrays and other mathematical data operations |
| Pandas libraries | It helps you to detailed analyse or explore python-based data analysis process | It provides you series and dataframe method to analyse data with more details |
| Matplotlib libraries | Especially it helpful to chart data visualization task activities | We can design and develop any graphs and charts data with it |
An easy way to remember these three library frameworks in Python.
- NumPy → Calculate numeric and data values
- Pandas → Analyze data and information in array object values
- Matplotlib → Visualize given x and y chart coordinates values information
Real-world example in Python.
Let’s assume we have a CSV file containing sales information for a company.
date, product_name, price
2026-01-07, MacBook Pro, 150000
2026-04-08, Apple iPhone, 90000
2026-05-09, HP Pavilion, 127000
2026-07-10, Samsung Tablet, 89000
A Python program can do this for you based on this data.
Use the Pandas library.
df = pd.read_csv(“company_sales.csv”)
Step 2 — Analyze company sales numbers.
Use the Pandas/NumPy library.
total_price = df[“price”].sum()
average_price = df[“price”].mean()
Step 3 — View the results of the company price sales table.
Use the Matplotlib library.
plt.bar(df[“product_name”], df[“price”])
plt.show()
All of this combination makes Python programming a powerful tool for any type of data analysis.
Advantages of using the NumPy, Pandas, and Matplotlib libraries in Python.
NumPy libraries.
- NumPy is helpful for very fast numerical operations in Python
- Helps with easy and efficient array data type value management
- In applying mathematical data calculation functions
- In linear algebra mathematical support tasks
- As a base extension for many scientific Python libraries
Pandas libraries.
- Easy Python table database manipulation operations
- Helpful in data cleaning tasks
- In CSV and Excel extension file handling processes
- In numeric data filtering and sorting tasks
- In grouping and aggregation numerical data calculation processes
Matplotlib libraries.
- Helps us create a variety of charts
- Can be highly customized if needed
- Useful for detailed data reporting and analysis
- Matplotlib libraries work well with the NumPy and Pandas frameworks
Conclusion of Using Libraries Like NumPy, Pandas, and Matplotlib.
In the Python programming language, NumPy, Pandas, and Matplotlib are three essential libraries or frameworks in the Python ecosystem. Python users can use all of these framework libraries as per their needs.